Create and Configure
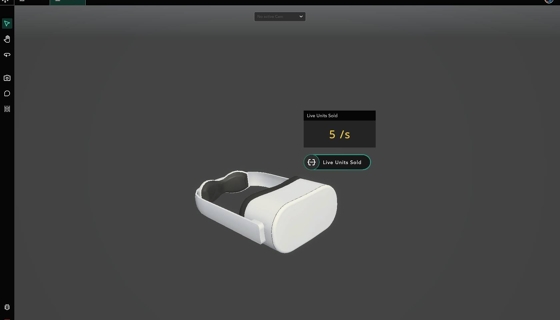
In this example, I have a model that I have added to my environment, and its corresponding Data Visualization gauge beside it. However, I wish to get more direct visual cues for my data. Follow this guide to set up the volumetric heatmap.
If you do not have the following yet, check out their corresponding pages to set them up:
a data source Add Data Source
a 3D model uploaded to Hiverlab's Central Platform
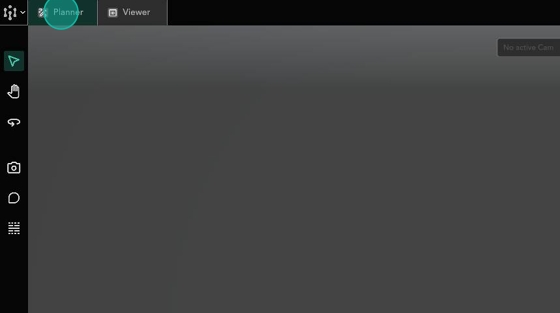
Ensure that you are in
Plannermode
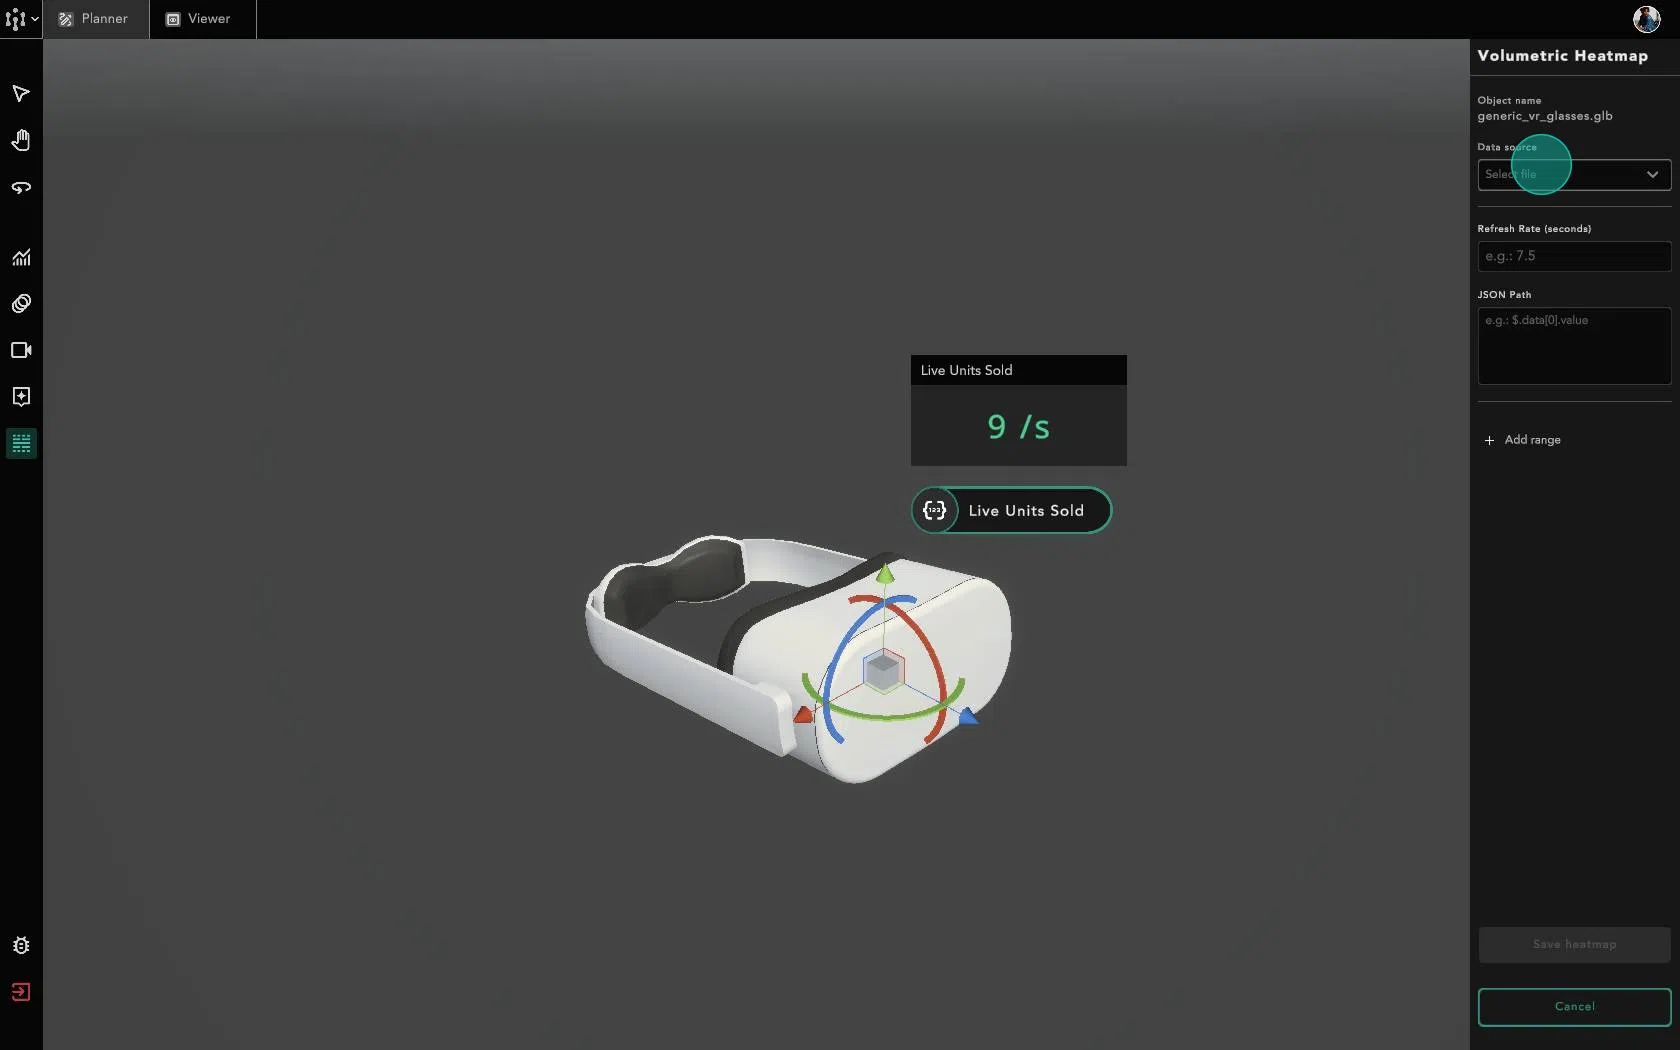
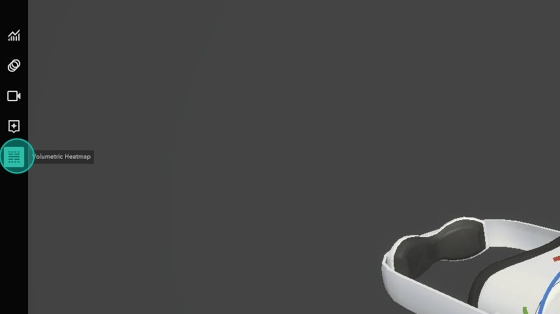
2. To create a heatmap, ensure that you have first selected an object, then click on the Volumetric Heatmap button on the left.
3. Fill in your desired data and ranges. Input a query to select the data you want from your data source. Query can either be a JSON path or SQL query depending on the data source. To learn how to choose the JSON path, see Specifying a JSON Path
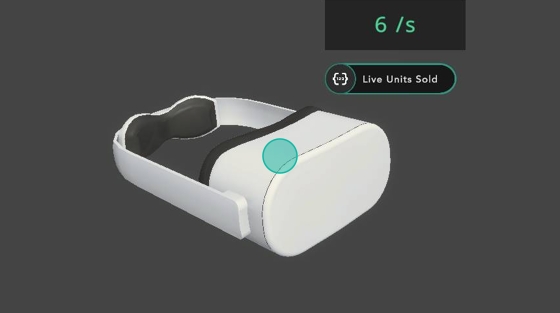
After saving your heatmap, you can View Heatmap by going to viewer mode.
Last updated