View Data Visualization
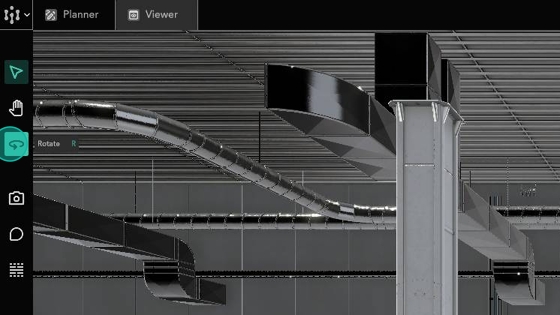
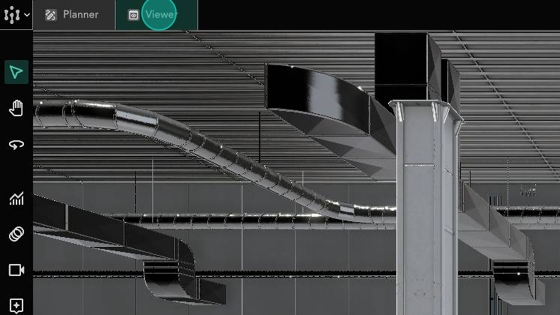
After creating your data visualisation, change to viewer mode
To get a different angle of your chart, click
Rotate
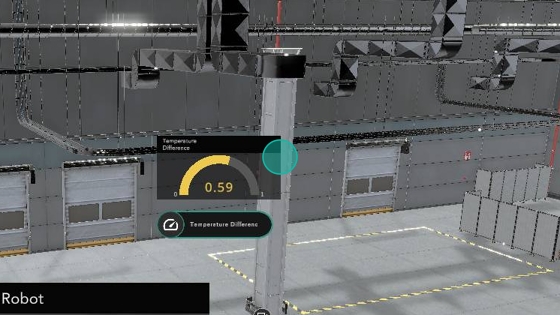
You can now view your new chart
Last updated
After creating your data visualisation, change to viewer mode
To get a different angle of your chart, click Rotate
You can now view your new chart
Last updated