Data Visualization
See your data in the environment
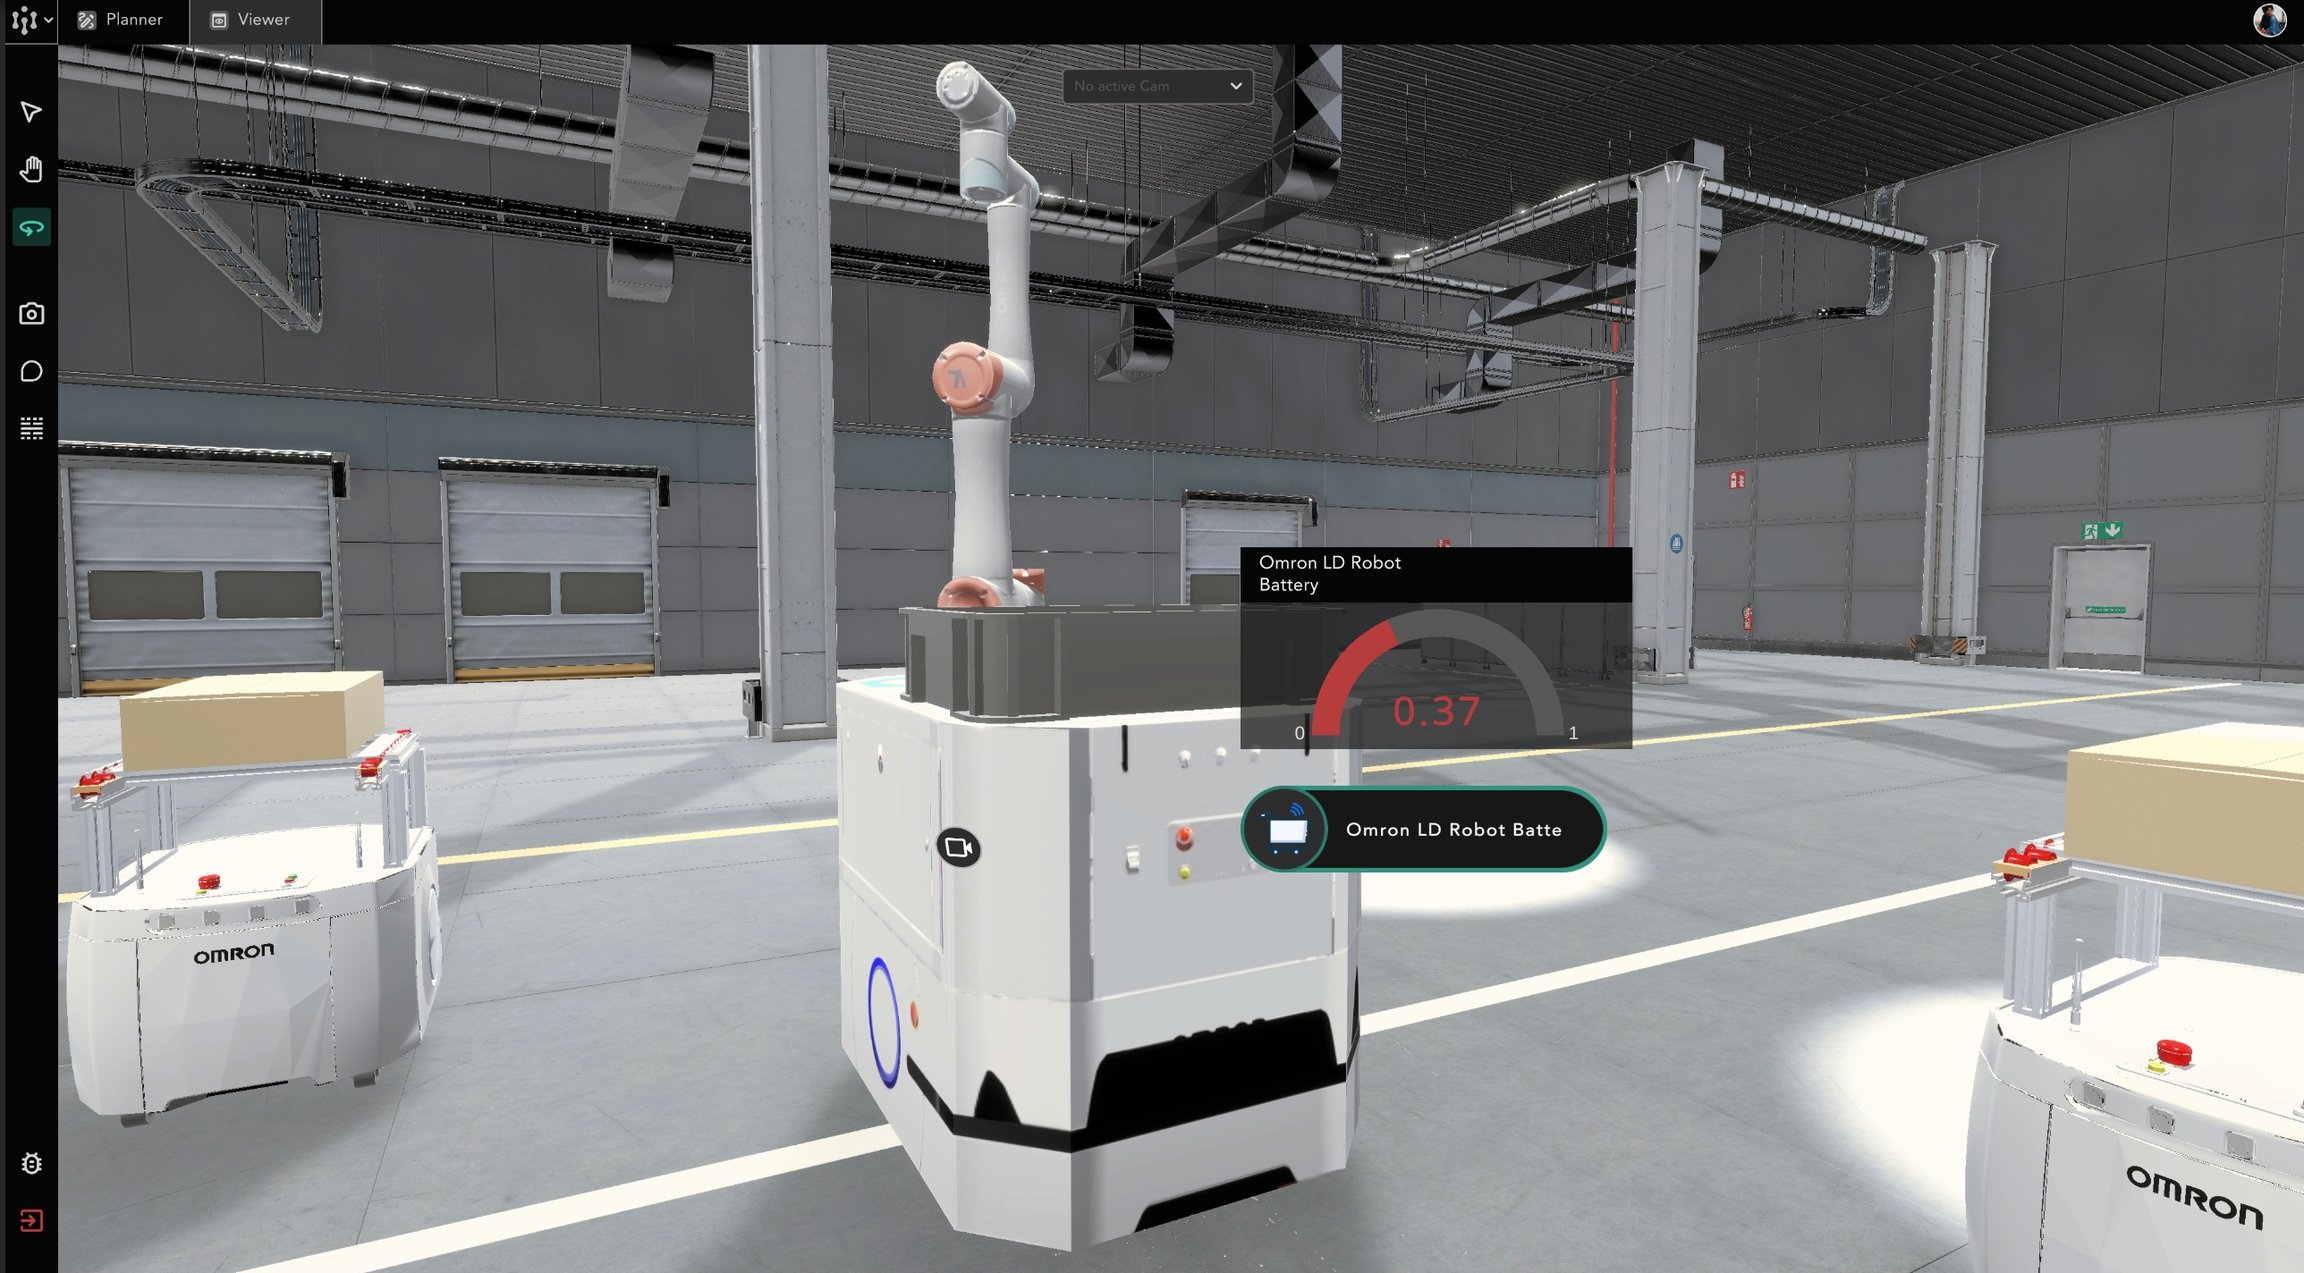
Data Visualization lets you monitor your live data in the 3D Environment. These can look like a raw number, a gauge, a table, or even a bar chart.
To create a data visualization, you need to added its data source to the project first. See Add Data Source to get started.
Afterwards, you can Create Data Visualization and Edit Data Visualization in your environment.
Last updated