Edit Data Visualization
Change an existing chart's configuration
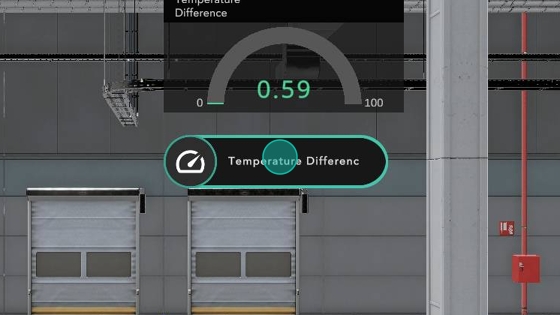
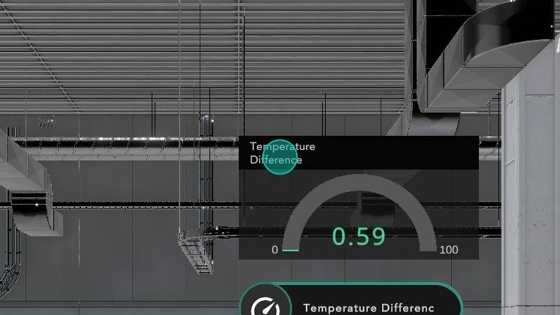
In this example, I have created a Gauge Chart that has ranges that are 100x too large. This is a guide on how to edit the data visualisation's configuration.
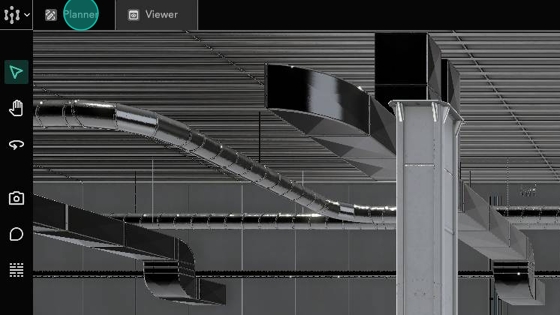
Ensure that you are in
Plannermode
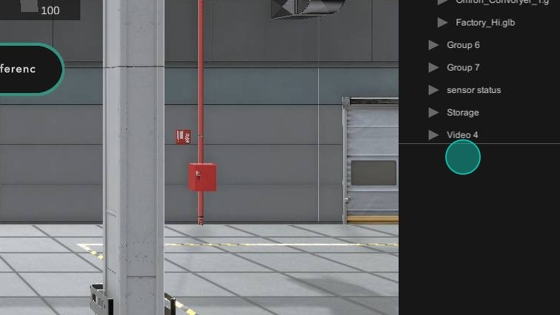
Note that the bottom part of the hierarchy is blank, meaning that no object is currently selected
Click your existing data visualisation to select it
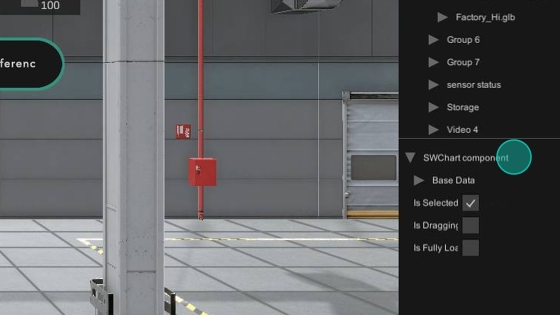
With the component selected, its details appear at the bottom of the hierarchy
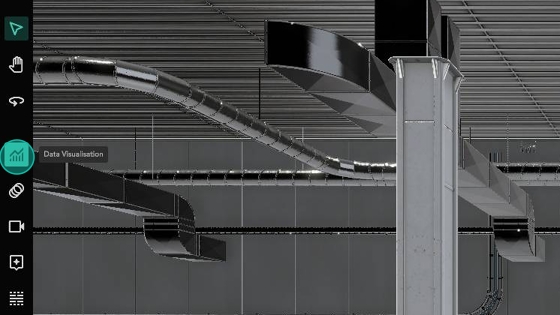
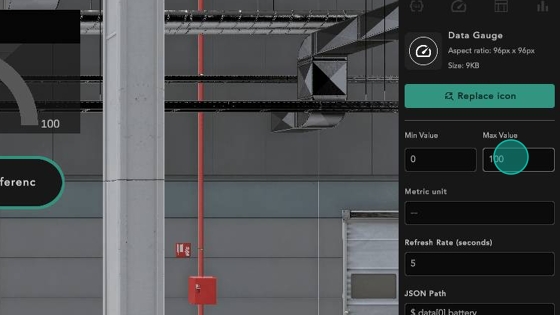
With the chart selected, edit it by clicking the
Data Visualisationbutton
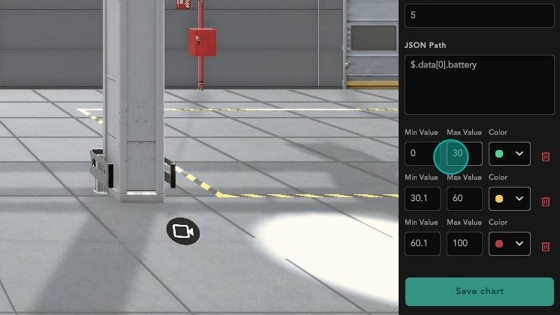
In this example, the values are 100x too large
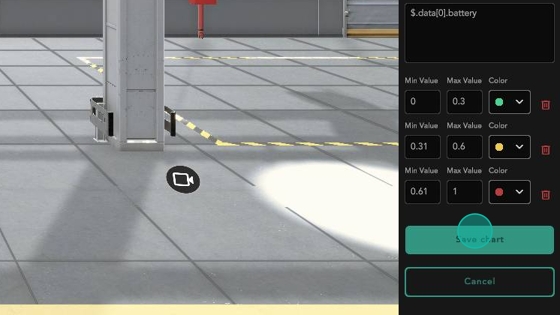
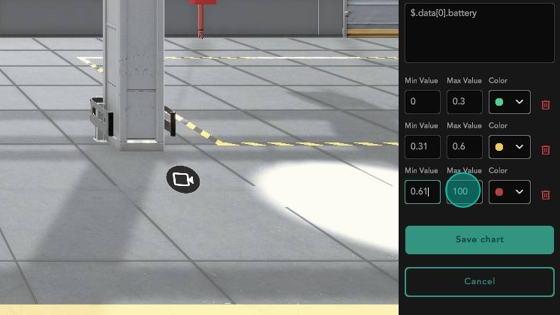
Make the necessary edits
I will also change the maximum value to 1.
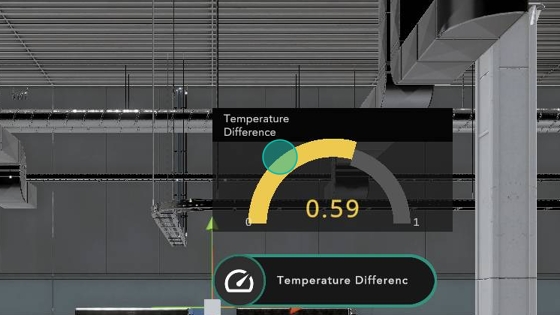
Save your edits
The scale of the value now shows correctly
Last updated